
Subnet TradingView chart
How to use the TradingView chart
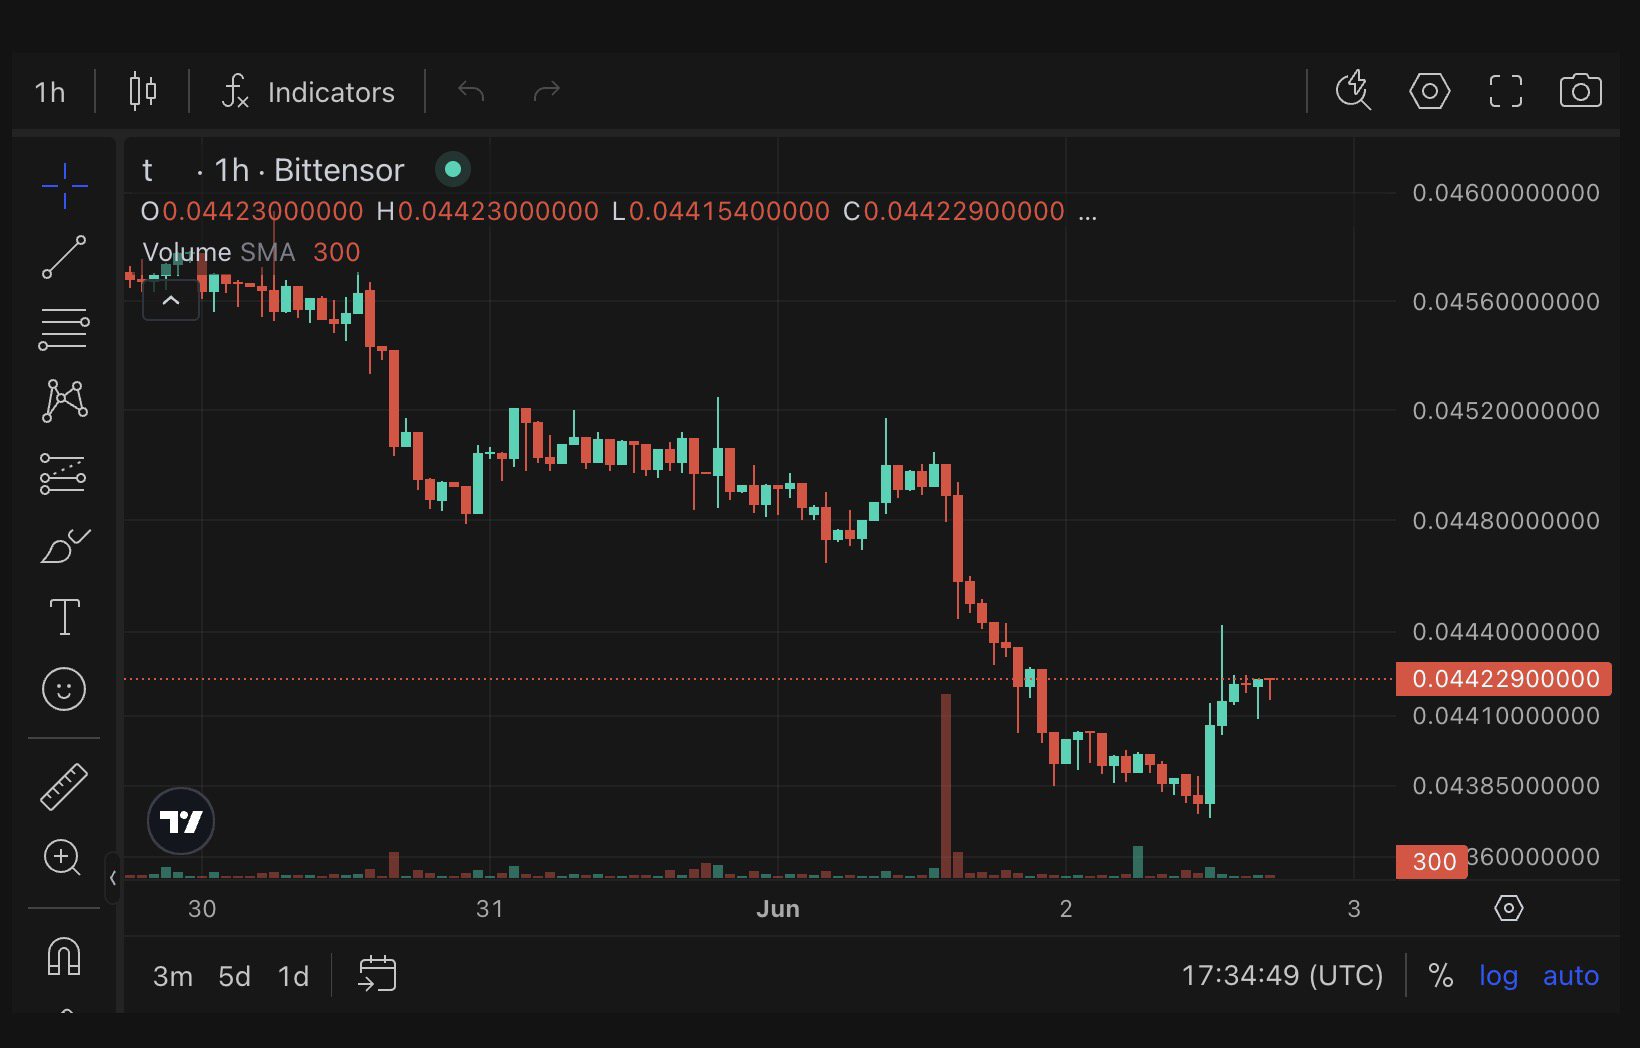
Each subnet has a TradingView chart showing the price of alpha over time. These charts are easily configurable, with many different options, and the same tools and timeframes you'd use to read a BTCUSD chart, applied to subnet alpha.
The default time for each point is 1 hour:
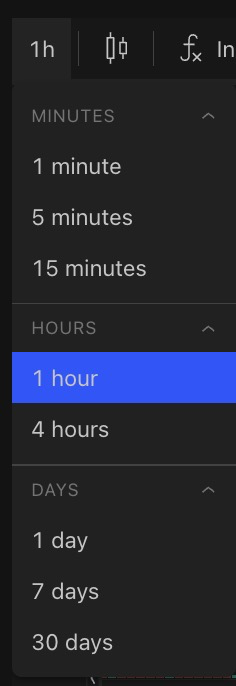
The display can be updated
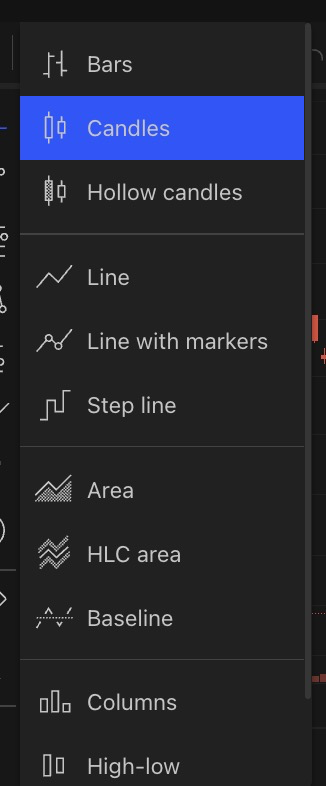
Your settings will be saved, and repeated across all subnets.
Updated about 1 month ago
Did this page help you?