Portfolio
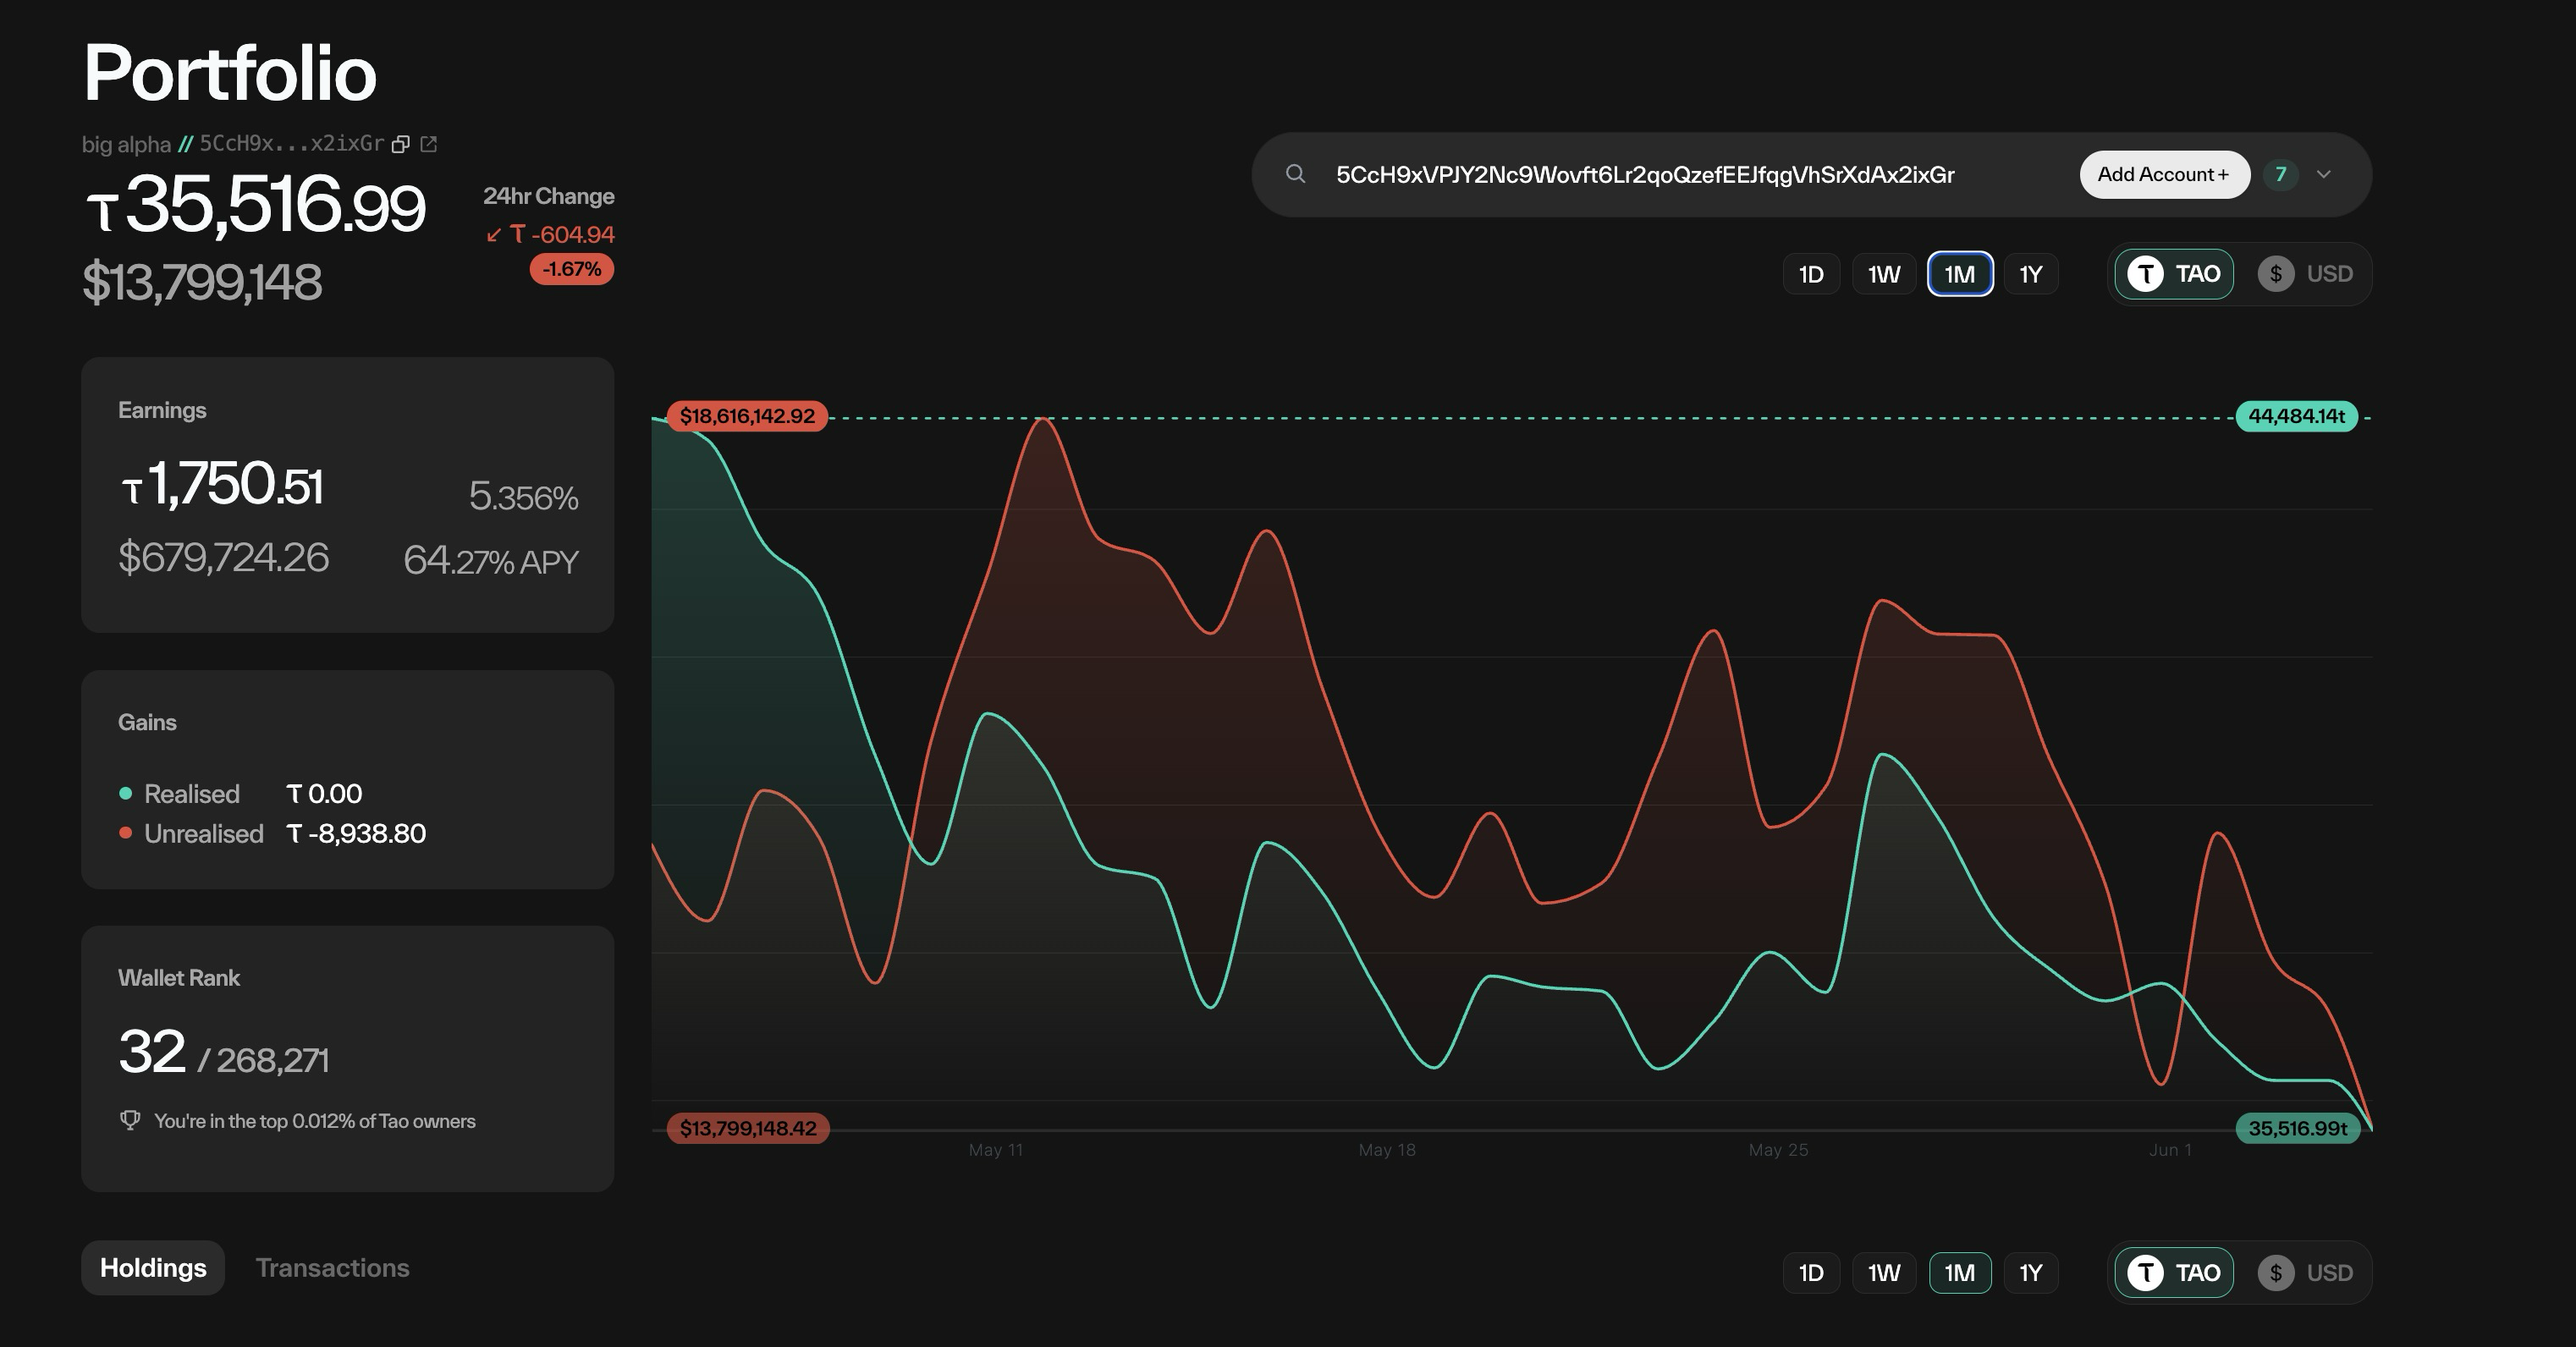
The portfolio page gives you detailed information about a wallet's staking history
When a wallet is selected, data begins to appear:
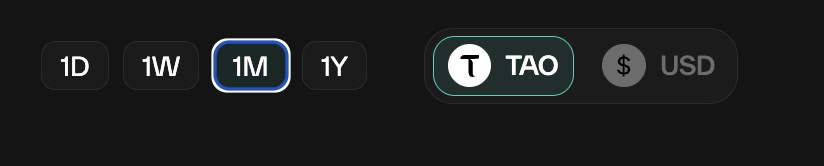
Changing the timeframe
The current view is 1 Month - in tao.
The timeframes available are 1D, 1W, 1M and 1Y. The values can be shown in Tao of USD.
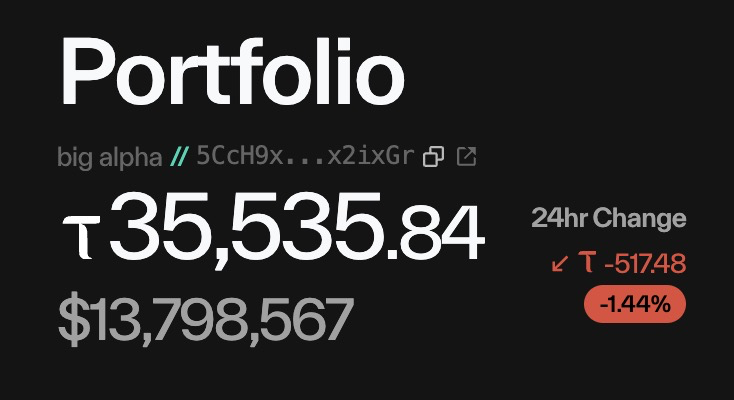
Balance
Wallet balance in tao and USD
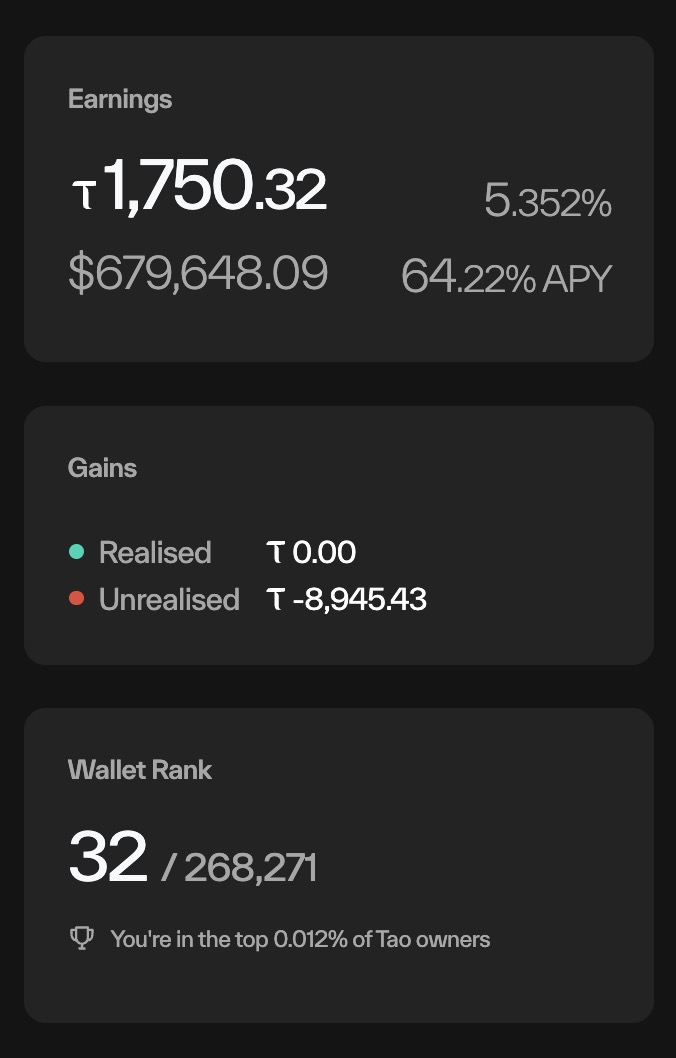
Earnings
The values here depend on the timeframe selected. This screenshow shows a 5% growth, and 64% APY if extrapolated for a year.
Chart
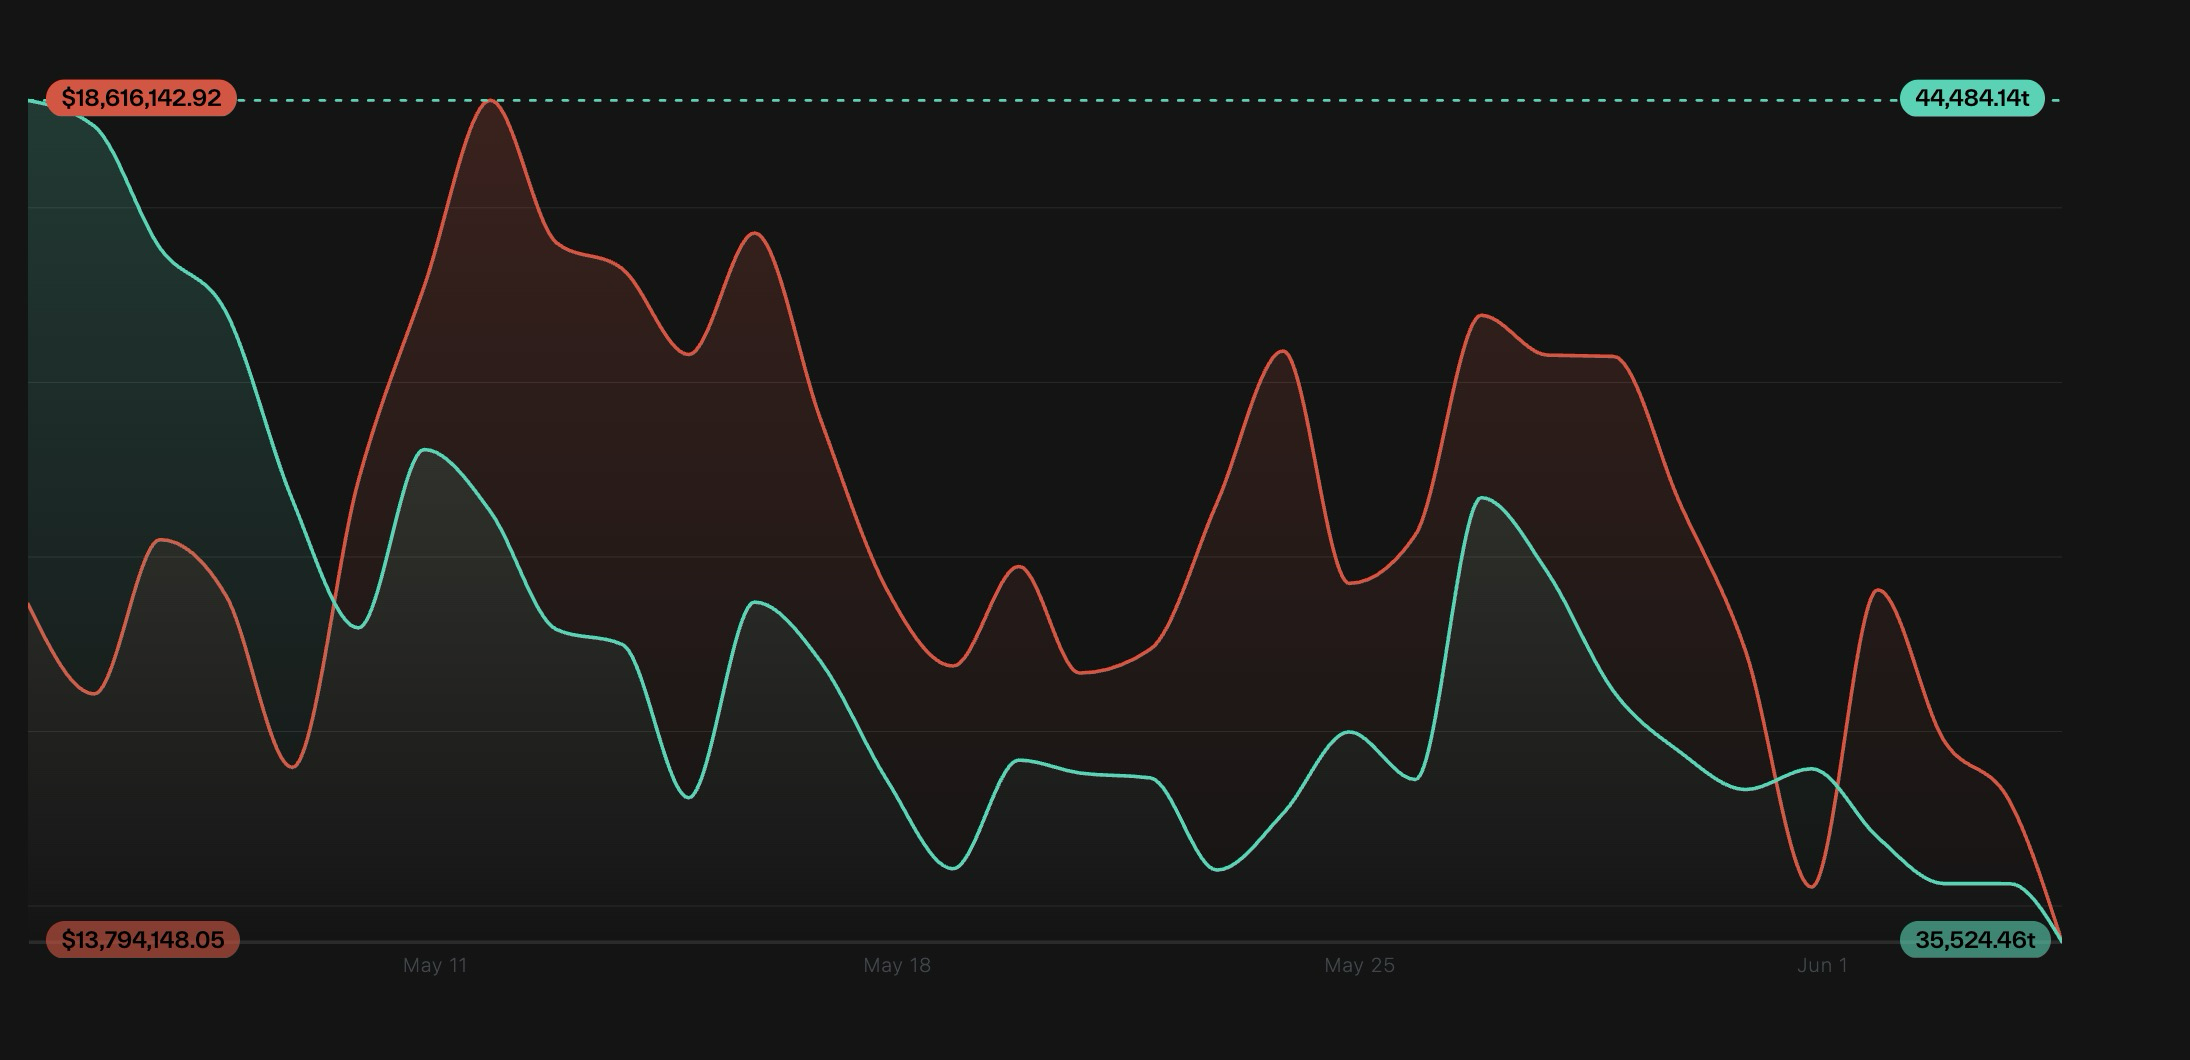
See how your portfolio has changed over time.
Red is USD value, and teal is tao value.
Holdings
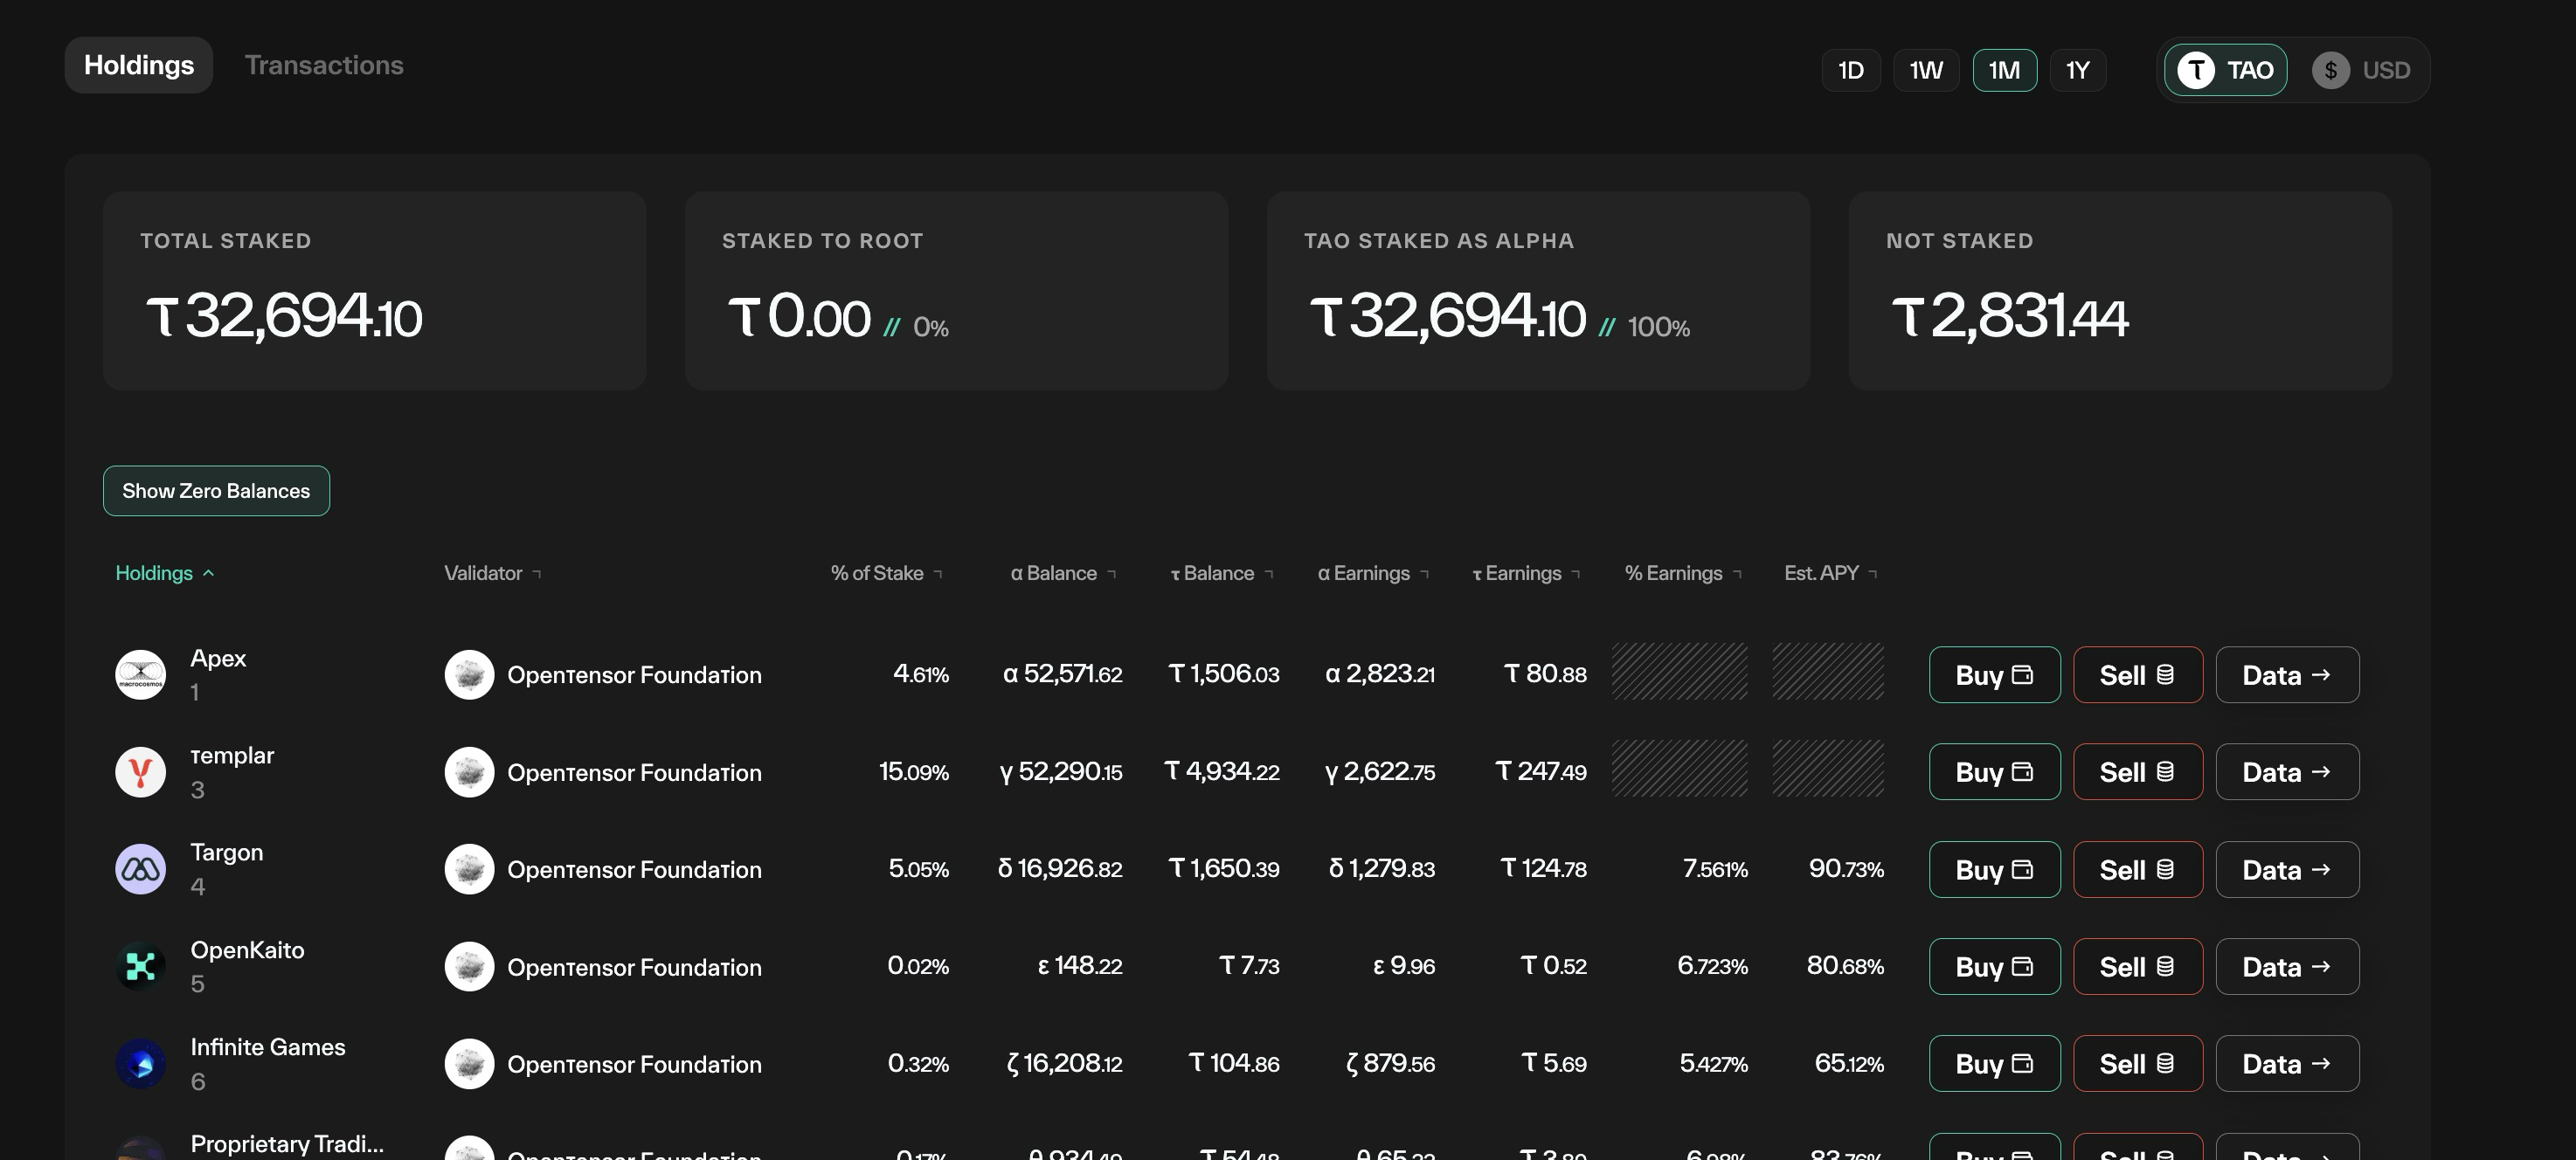
The holdings chart shows what alpha you hold.
- Holding: The subnet
- Validator: The validator you are staked to.
- % of Stake: Percentage of your stake on this vali/subnet combo.
- α Balance: Balance in alpha
- τ Balance: Balance in tao.
- α Earnings: Earnings in alpha over the selected timeframe
- τ Earnings: Earnings in tao over the selected timeframe
- % Earnings: Percentage chane over timeframe
- EST APY: Actual Earnings over the timeframe - extrapolated to one year.
Why is the % and APY grayed out?If you have purchased or sold alpha in the timeframe - we cannot calculate your actual earnings over that period. Try a shorter period, or wait until it has been a day/week, and your actual earnings will appear.
- Buy: But more of this alpha
- Sell: Sell this alpha
- Data: Dig deeper
Transactions
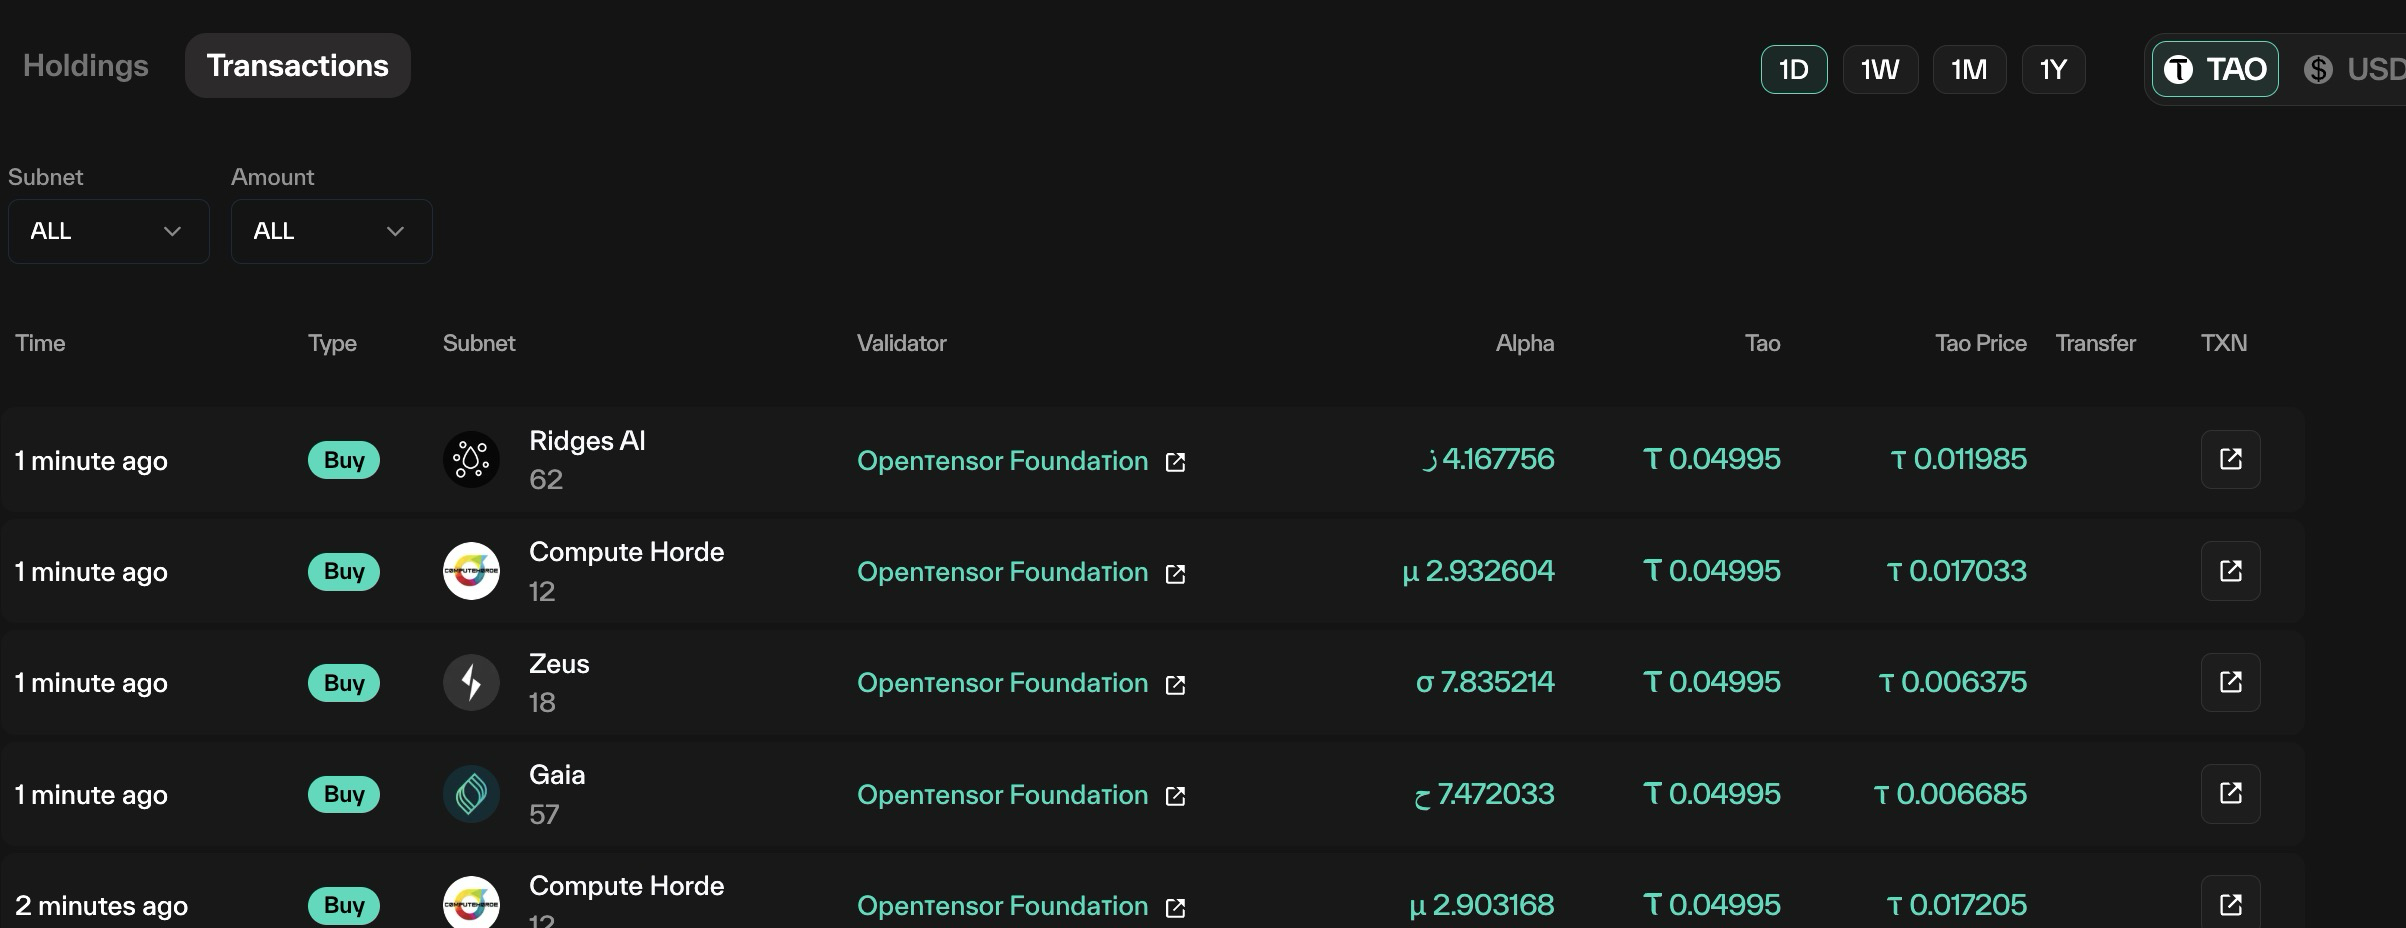
This table is simlar to Staking Transactions, but just for your wallet.
Updated about 1 year ago