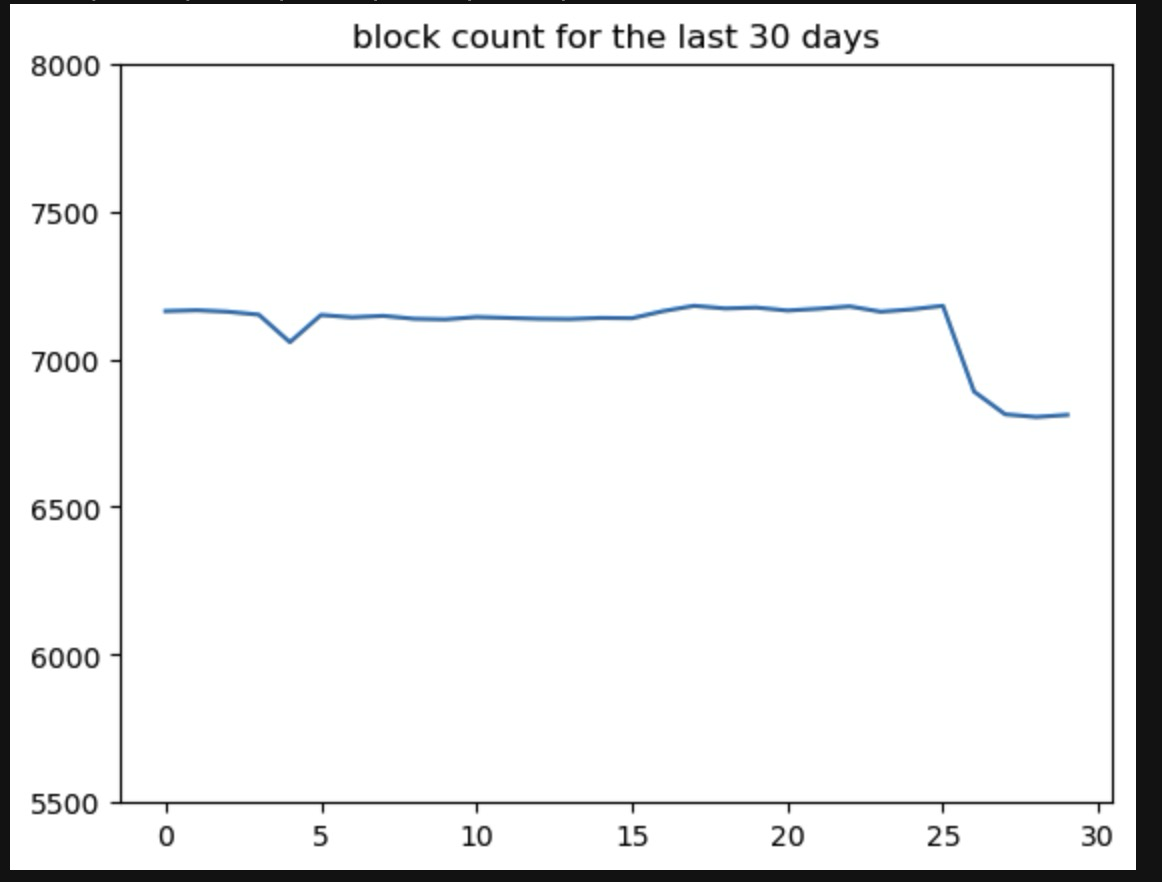
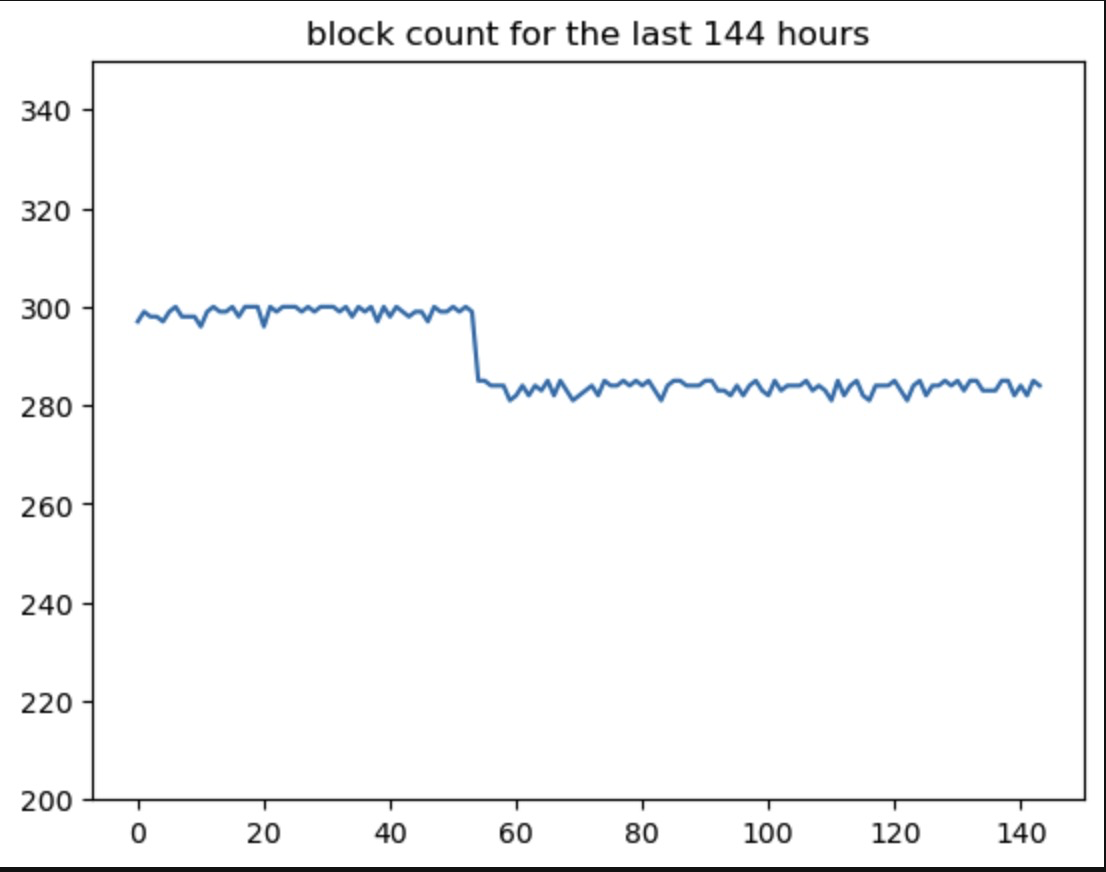
Blocks emitted over a time period
The Bittensor chain stives to emit 1 block every 12 seconds. However, chain congestion can slow down block emission. In this tutorial, we chart the number of blocks over a period of time - hours or days.
At 12 blocks/s, we should see ~300 blocks per hour, or ~7200 blocks per day. By creating a chart of the blocks per day, we can see that there is a potential congestion problem that has arisen in the last few days.


Creating the charts
We start off importing our libraries and setting parameters. In the sample below, I have 30 days as the parameters. The 2nd chart above used 144 hours.
import requests, json
import matplotlib.pyplot as plt

from datetime import datetime, timedelta

#parameters
#allowed days or hours
scale = "days"
number_of_points = 30
Note that this will makenumber_of points+1 API calls.
We define our API key and 2 functions to handle date formatting (this demo was created on a beta version of taostats, and this is unlikely needed in prod)
api_key="your_api_key"


#datetime formatting
def format_string_into_datetime(dt):
    format = ["%Y-%m-%dT%H:%M:%SZ","%Y-%m-%dT%H:%M:%S.%fZ"]
    for fmt in formats:
        try:
            return datetime.strptime(dt, fmt)
        except ValueError:
            continue
    raise ValueError("None of the formats matched the datetime object")
def format_datetime_into_string(dt):
    format = ["%Y-%m-%dT%H:%M:%SZ","%Y-%m-%dT%H:%M:%S.%fZ"]
    for fmt in formats:
        try:
            return dt.strftime(fmt)
        except ValueError:
            continue
    raise ValueError("None of the formats matched the datetime object")
We make our first API call to get the current block, and extract the timestamp.
#get current block
url = f"https://beta-api.taostats.io/api/v1/block?limit=1"
headers = {"accept": "application/json", "authorization":api_key}
response = requests.get(url, headers=headers)
resJson = json.loads(response.text)
#print(resJson)
current_block = resJson['blocks'][0]['block_number']
current_block_timestamp = resJson['blocks'][0]['timestamp']
# Convert the string timestamps to datetime objects
print(current_block_timestamp)

block_time = format_string_into_datetime(current_block_timestamp)
Now we can loop over the day_counter and find the blocks hours or days ago, abd build an array of these blocks. This API call finds the time - and then looks for blocks over a 1 minute time range to ensure that there is a block in the data.
blocks = []
day_counter =0
while day_counter < number_of_points:
#oldest day is number_of_days - day_counter
days_ago = number_of_points - day_counter
if scale =="days":
day_max = block_time-timedelta(days=days_ago)
else:
day_max = block_time-timedelta(hours=days_ago)
day_min =day_max -timedelta(minutes=1)
day_max= format_datetime_into_string(day_max)
day_min= format_datetime_into_string(day_min)
#print(day_max)
#get block closest to day_max
url = f"https://beta-api.taostats.io/api/v1/block?timestamp_start={day_min}×tamp_end={day_max}&limit=1"
headers = {"accept": "application/json", "authorization":api_key}
response = requests.get(url, headers=headers)
resJson = json.loads(response.text)
#print(resJson)
day_block = resJson['blocks'][0]['block_number']
blocks.append(day_block)
day_counter +=1
#add the current block
blocks.append(current_block)
#Now that we have all the block numbers, we can calculate the difference, which will tell us how many blocks were emitted over each timeframe:
#now get the difference
block_delta = []
i=0
while i< len(blocks)-1:
    delta = blocks[i+1] - blocks[i]
    block_delta.append(delta)
    i+=1

print(block_delta)
And finally, let's chart the data:

Updated 9 months ago
