Emissions for Validators
How we got here
How are emissions calculated for Validators?
Terms to know
VTrust
- Validators test miners and create a weighted list of scores. These are submitted to the Yuma consensus.
- These scores are compared to the other validators - and each validator is judged to be in consensus with the rest of the validators.
If a Validator is judged to be out of consensus, their VTrust (validator trust) will decrease. VTrust is a value between 0 and 1, where 0 is terrible, and 1 is perfect.
The other value in the determination of validator emissions is the stake weight. Validators with higher stake weight will receive higher emissions.
- root_stake: The amount of tao staked to a validator on root.
- tao_weight : Defined on chain as 0.18.
- alpha_stake: The amount of alpha staked to a validator on the subnet
- total_stake: The value used to determine emissions.

Dividends
Dividends are the percentage of the total validator emissions that will be given to each validator. It is calculated from VTrust and total_stake. High stake & high VTrust lead to high dividends. High dividends yield high emissions.
- The sum of all dividends on a subnet is 1.
- Dividend score is calculated once per tempo (360 blocks for most subnets).
Calculating Validator Emission
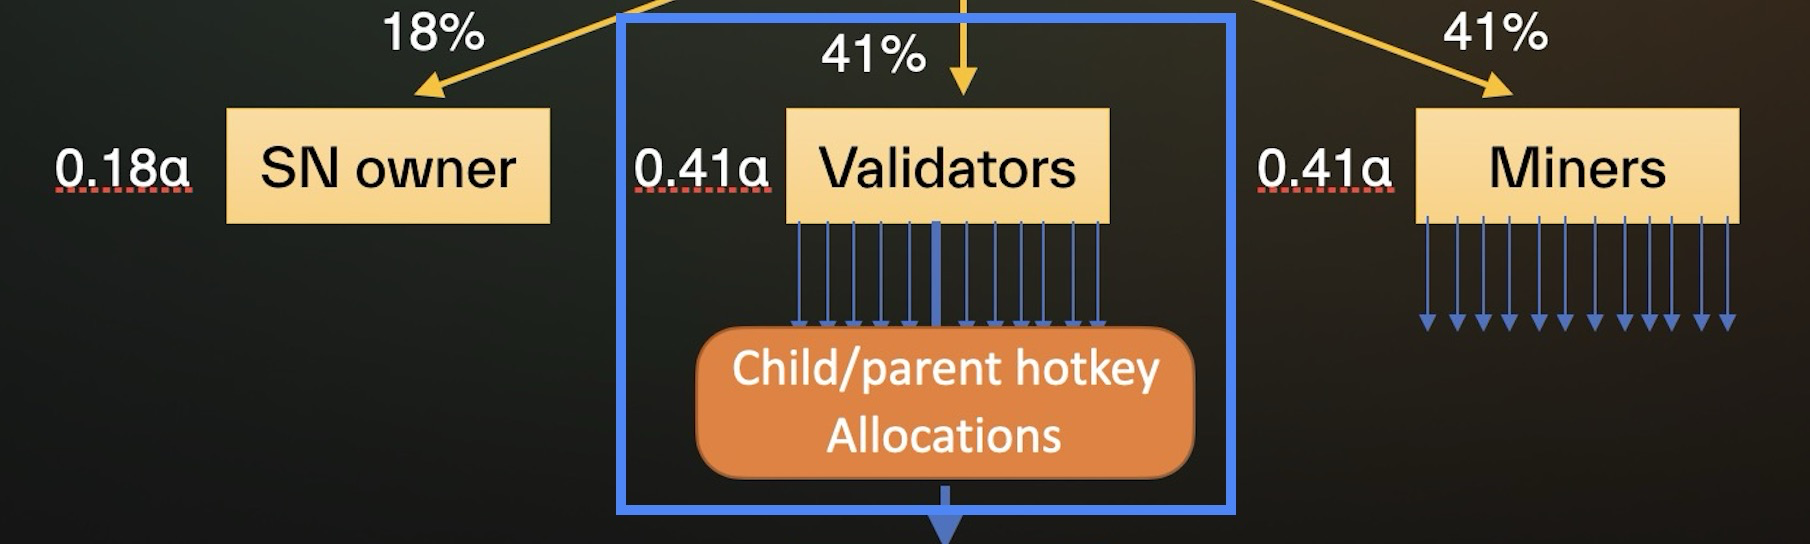
- Validators receive 41% of the
alpha_outsubnet emission. - The validator's dividend score gives the fraction of the Validator alpha that is awarded.
Emission math exampleA subnet receives 1
alpha_outper block.In 1 epoch - 1*360 = 360 alpha.
Validators receive 41% of the subnet' emissions. 360*.41 = 147.6 alpha
Validator x has dividends of 0.006. 147.6*0.006 = .8856 alpha per epoch.
Validator x has 0.8856 alpha emission.
If this validator has parent hotkeys this will be divided amongst the validators based on the stake (see Emission for Parent/Child Hotkeys).
This will then be divided into root emission (and converted into tao) and alpha emission (see )Emissions: Root vs. Alpha Stake.
Validator rewards
We have calculated the emission to the validator, but this is further split by several factors:
- Parent hotkeys receive their percentage of the stake.
- The validator may take a
child_takefrom this emission.
- The validator may take a
- Each Subnet has a root: alpha proportion that divides the emissions.
- Both alpha and root proportions may have a validator take.
- This is the reward for the validator.
- The remaining root and alpha reward is divided amongst stake nominators.
Next Steps
- Emission for Parent/Child Hotkeys: Dividing dividends to parent/child hotkeys.
- Emissions: Root vs. Alpha Stake Dividing between root & alpha proportions.
- Stakeholder Emissions: Root & Stakeholder Emissions: Alpha: distribution of emissions to stakeholders.
Updated about 1 year ago