
Subnet Emission
To see a chart of subnet emissions, click the Blockchain dropdown, and choose Subnets.
The chart shows the percentage of emission for each subnet (this is determined by the Yuma Consensus on the Root Subnet. This data is also available in the Root Subnet chart on the Taostats homepage.
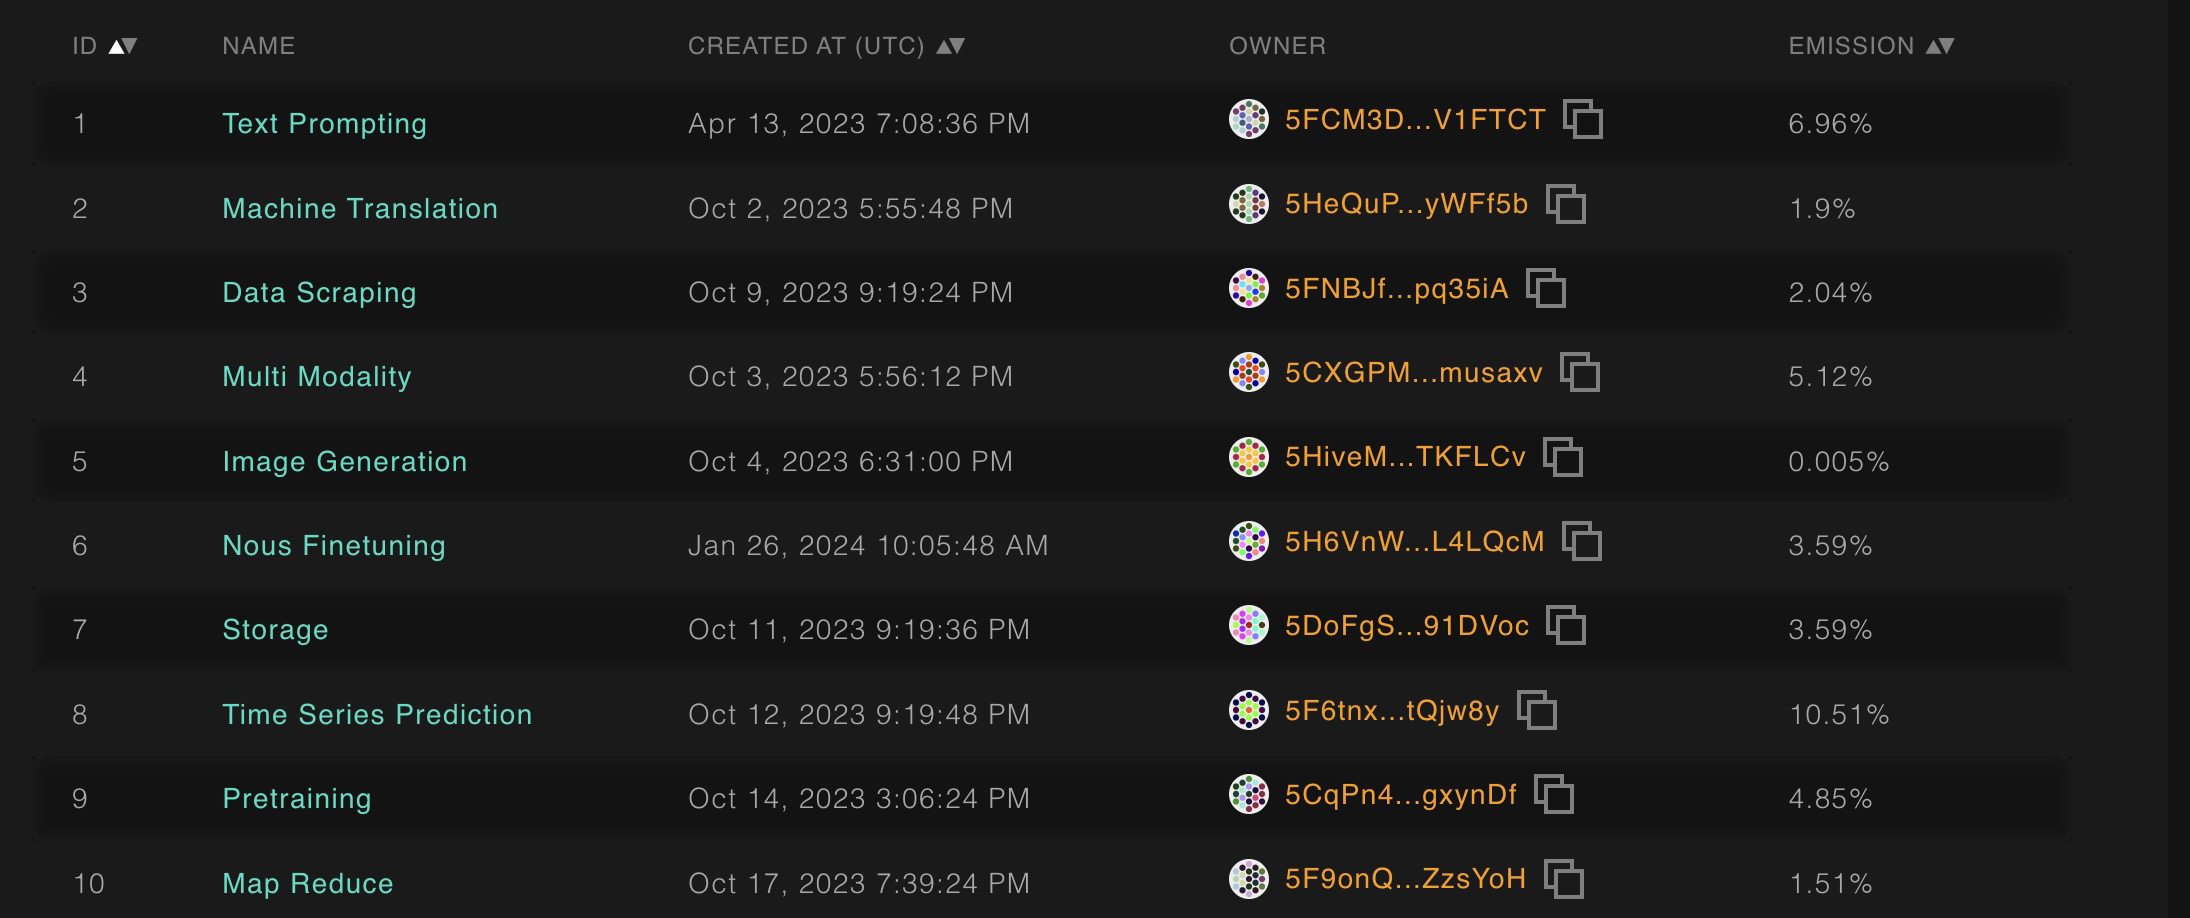
Initially sorted by SubnetID, sorting by emission shows the subnets that receive the highest/lowest allocation of TAO.
Updated 3 months ago